
Every clip Opus Clip produces arrives with a number stamped on it, and the number is almost always high. That is the first thing to understand about the Virality Score: across our own pipeline of 7,101 generated clips, 82% scored 80 or above. A metric where four in five items clear the “high” bar is a good way to sort a pile of clips and a poor way to predict which one will actually get views.
Disclosure: I run ScaleReach, which competes with Opus Clip and also assigns every clip a virality score. There is no affiliate relationship. Every Opus Clip fact below is quoted from a page Opus Clip controls, read on 2026-09-26 and linked, and the ScaleReach figures come from our own production database and source code so you can weigh the bias for yourself.
The 60-second verdict
Trust it to rank a batch. Used to order a review queue, the score reliably floats stronger moments toward the top. That is genuinely useful when the alternative is watching thirty clips at 1x.
Do not trust it to predict views. No public calibration ties an Opus Clip score to real-world performance. A 90 is not a 90% chance of going viral, and scores cluster so tightly near the top that the gap between an 88 and a 94 tells you very little.
Do not trust it outside talking-head content. The score reads spoken-word signals, so it misses visual-only humor and silent gameplay. Opus Clip’s own developer docs tell you to lower your threshold for anything that is not a person talking.
Bottom line: treat the Virality Score as a queue, not a verdict. Watch the top few, read the reasoning it shows you, and let your own judgement decide what to post.
What is the Opus Clip Virality Score?
The Virality Score is a per-clip number Opus Clip assigns to predict how likely each clip is to go viral, shown next to every clip so you can rank them against each other. Per Opus Clip’s own help centre:
- It ranges from 0 to 99, higher meaning a greater predicted chance of engagement and shares.
- Clips are sorted by score, highest first, by default on the results page.
- It is available only on the Pro and Starter plans. Free-plan users cannot see it at all.
- You can view it in both grid and list layouts.
Source: help.opus.pro — What is the Virality Score on OpusClip? (verified 2026-09-26).
One small inconsistency worth flagging, because it is a live example of how these numbers get copied rather than checked: Opus Clip’s dedicated help article says the scale is 0 to 99, but Opus Clip’s own developer API blog and several of its marketing pages describe a 0 to 100 scale. When a vendor’s own surfaces disagree by a point, the dedicated documentation is the one to quote. We use 0 to 99. We wrote about the same mismatch when we compared scoring across six clip tools.
How is the Virality Score calculated?
Opus Clip publishes the four things its AI evaluates, which is more than most tools in this category disclose. From the same help article:
| Factor | What Opus Clip says it checks |
|---|---|
| Hook | Does the introduction grab attention and relate directly to the main topic? |
| Flow | Does the video move logically from one part to the next, with a satisfying conclusion? |
| Value | Does it offer value, resonate emotionally, and create a personal connection? |
| Trend | Is it aligned with current trends and audience interests? |
On top of those four, when you use the ClipAnything model Opus Clip also checks whether a clip is relevant to your prompt. What it does not publish is the weighting between the four factors or the training data behind the “Trend” judgement, so the exact recipe stays private.
A useful outside observation: in a hands-on write-up, Marc Andrews found each of the four components is shown per clip as a letter grade rather than folded invisibly into one number. On his top clip all four graded A; on a clip two points lower, three graded A and Trend came in at A-minus. The components genuinely move, which is a point in the score’s favour.
So how accurate is it, really?
Here is the honest answer in one line: the Virality Score is a well-built ranking signal and an unproven predictor of views. Those are two different claims and the distinction is the whole point.
It ranks clips sensibly. Everyone who has used it, us included, sees the same pattern: high-scored clips beat low-scored clips on average. That makes it a legitimate triage tool.
But the scores bunch at the top, which caps how much a high number can tell you. This is the part no marketing page mentions, and it is the easiest thing for us to show with our own data rather than assert. Below is the clip list for a single Joe Rogan episode we ran through ScaleReach. Of the 61 clips it produced, 55 scored 80 or higher, and none scored below 70.
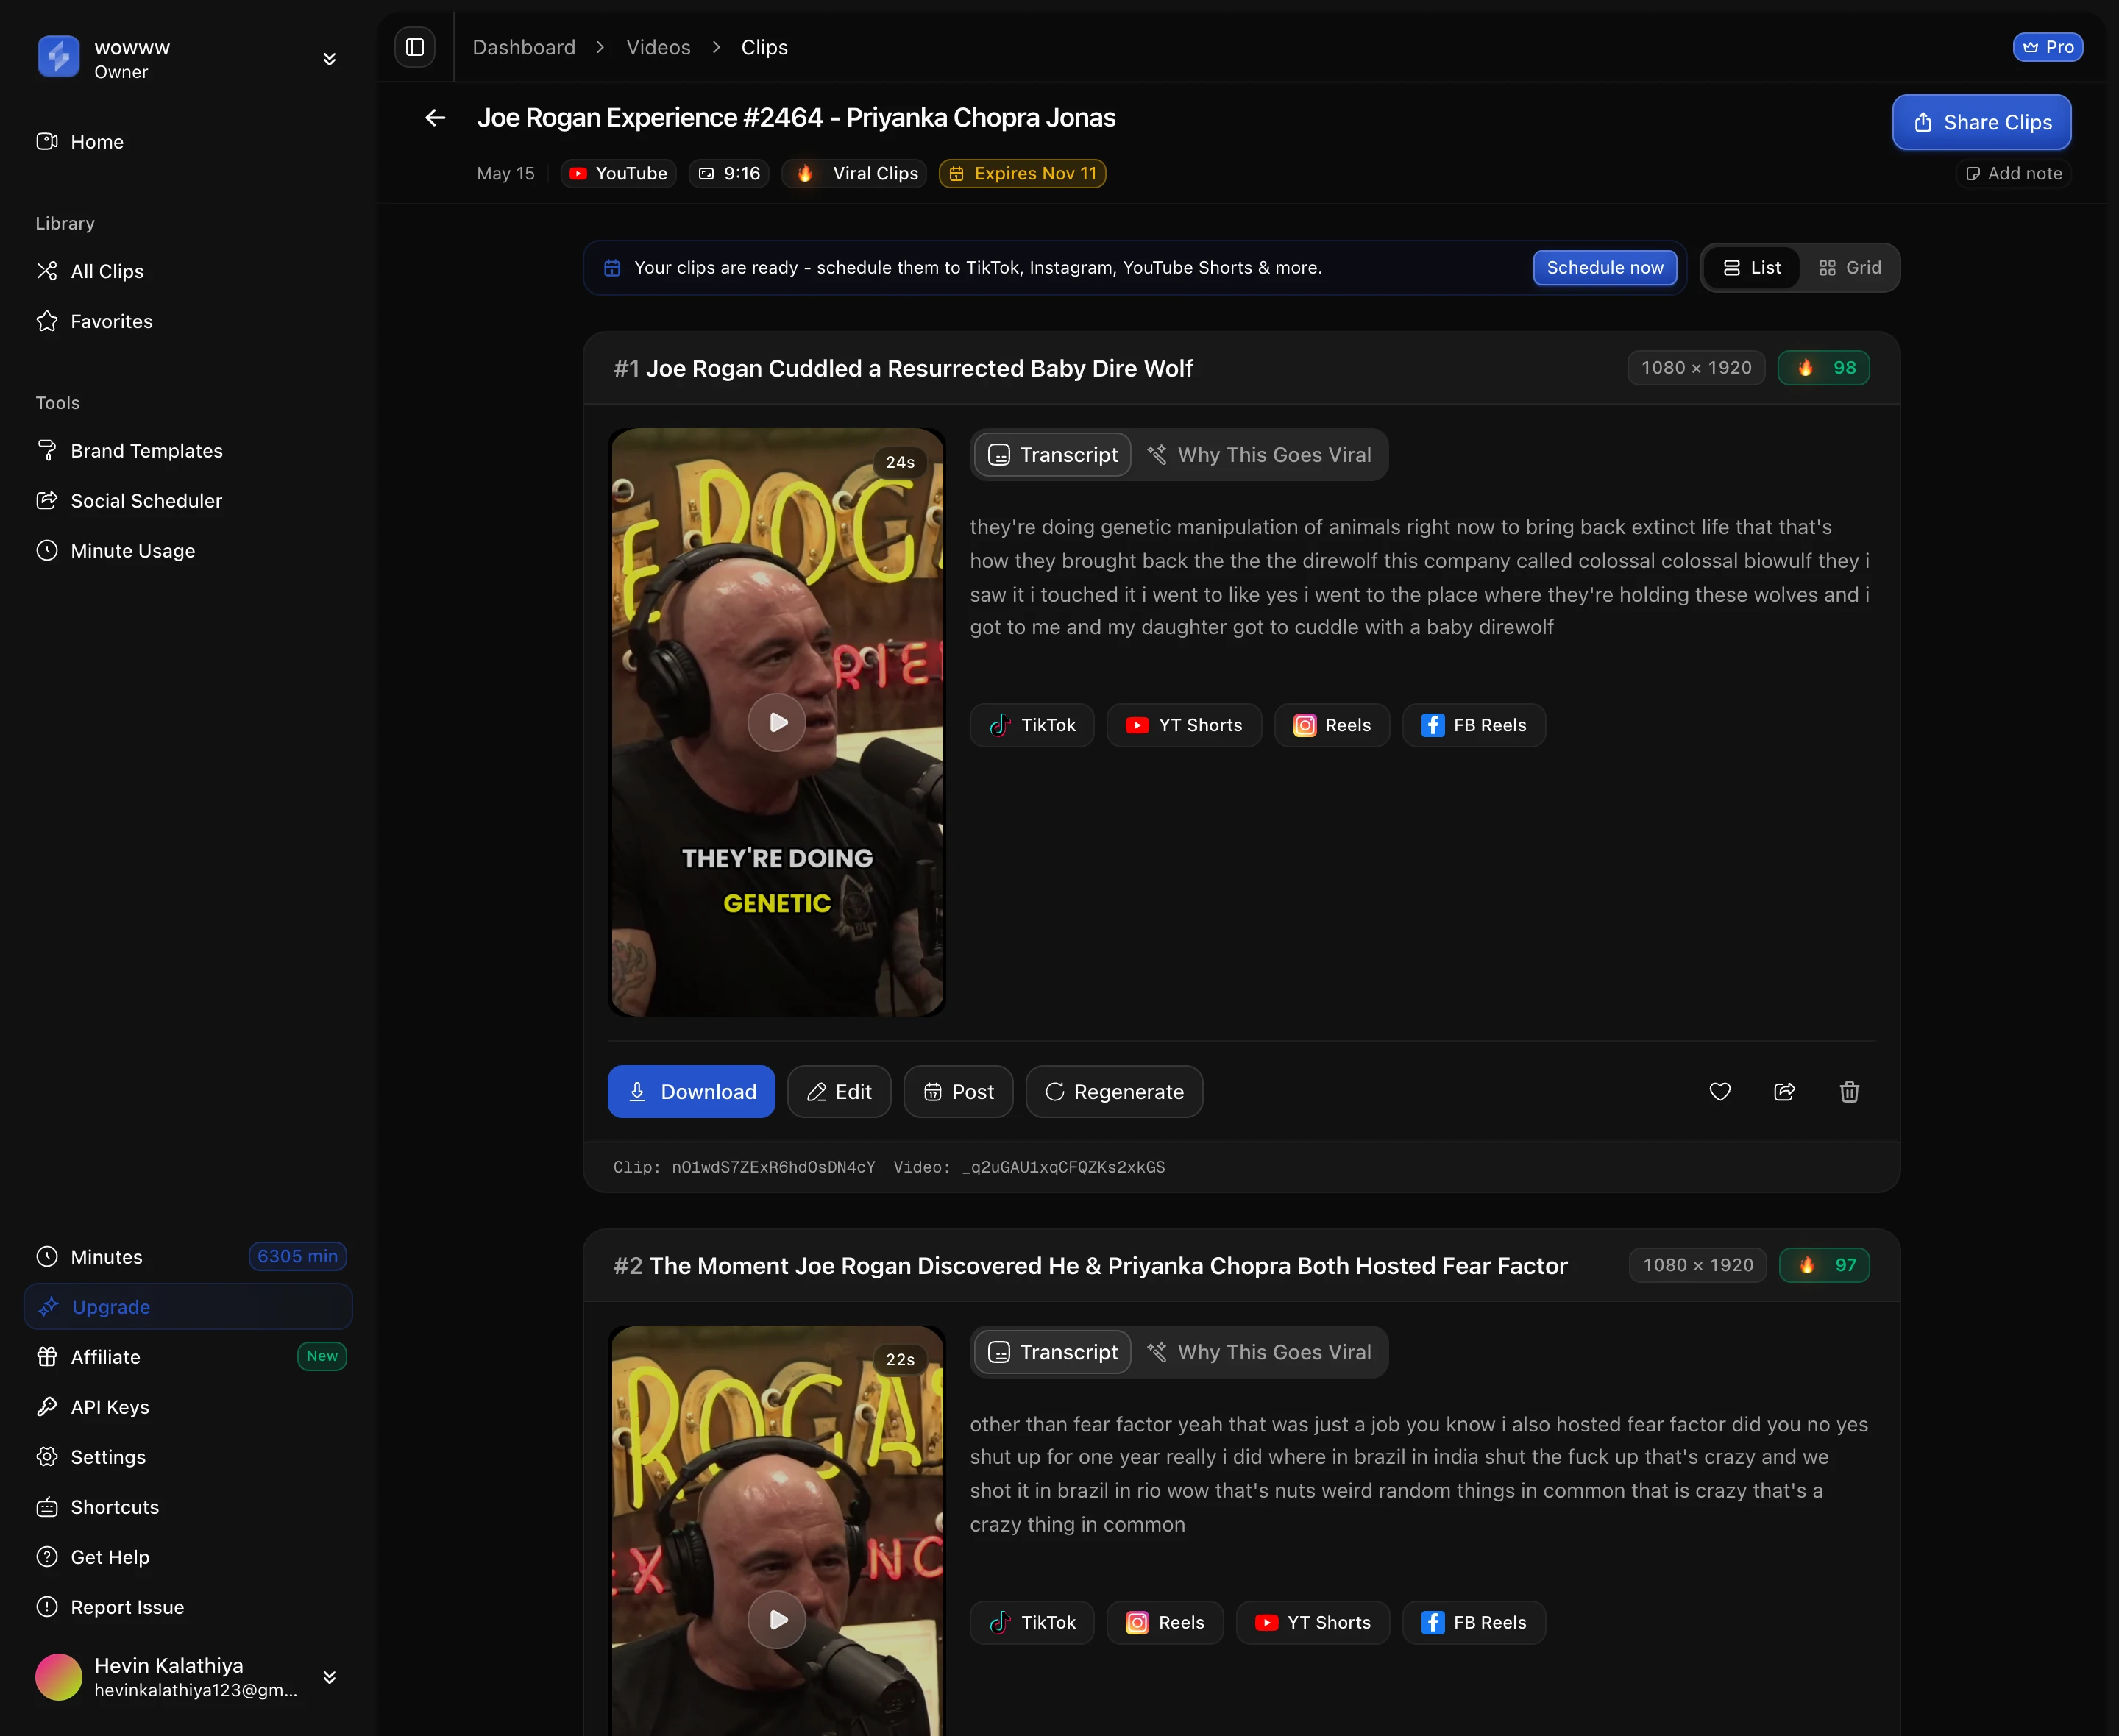
When almost every clip lands in the high band, the score stops discriminating where it matters most. “Post the 98 over the 88” is a much weaker instruction than the two-point gap makes it feel. This is not unique to us. Marc Andrews’ 21 clips from one talk ran from 98 “down into the eighties.” Bunching near the top appears to be how these models behave in general.
There is no public calibration. A score of 90 is not a 90% chance of anything. As one analysis of AI virality scores puts it, dividing a score by its maximum does not establish a probability — you would need the provider to define the success event and demonstrate calibration against real outcomes, and no clip tool publishes that. Opus Clip’s developer docs do make a stronger claim for the API version of the model: that a score of 70+ predicts above-median performance “roughly 75% of the time on talking-head content.” That is a vendor claim on a marketing page, it is explicitly limited to talking-head content, and it describes above-median performance, not views.
Nobody has published a proper tracked test, including us. The most careful independent write-up ran a single video and, by the author’s own admission, published no clips and therefore measured no real performance. Small “accuracy tests” that post ten clips and eyeball the result exist, but ten clips cannot establish accuracy in any rigorous sense. So be sceptical of any page, this one included, that hands you a tidy accuracy percentage.
Where the score is blind
The Virality Score reads the transcript and the spoken delivery. That is why it works on podcasts and interviews and struggles elsewhere.
- Visual-only humor. If something funny happens on screen and nobody comments on it, the score cannot see it.
- Silent gameplay and screen-shares. Gaming highlights and demos carry their value in the picture, not the words, and the score reads that as a flat clip. Our own Opus Clip review documents the same weakness, and it is a limitation we share on gameplay footage.
- Non-talking-head content in general. Opus Clip’s developer guidance is blunt about it: for b-roll, music, or animation, lower your score threshold by 10 to 15 points, because the same model scores them lower for reasons that have nothing to do with quality.
How to actually use a virality score
Treat it as a queue, not a filter. The recommended workflow, which matches how we tell ScaleReach users to work, is short:
- Sort by score and watch the top few. That is what the ranking is good for. In our own library the score is the default sort key for exactly this reason.
- Read the reasoning before you dismiss a low scorer. Both tools show a written explanation next to the number; twice in Marc Andrews’ run a clip in the eighties was the better fit for a specific point than one in the nineties.
- Never let the score gate publishing. A low number is a suggestion to look harder, not an instruction to bin the clip. Opus Clip hands you every clip regardless of score, and so do we.
- Drop your expectations for anything that is not talking-head.
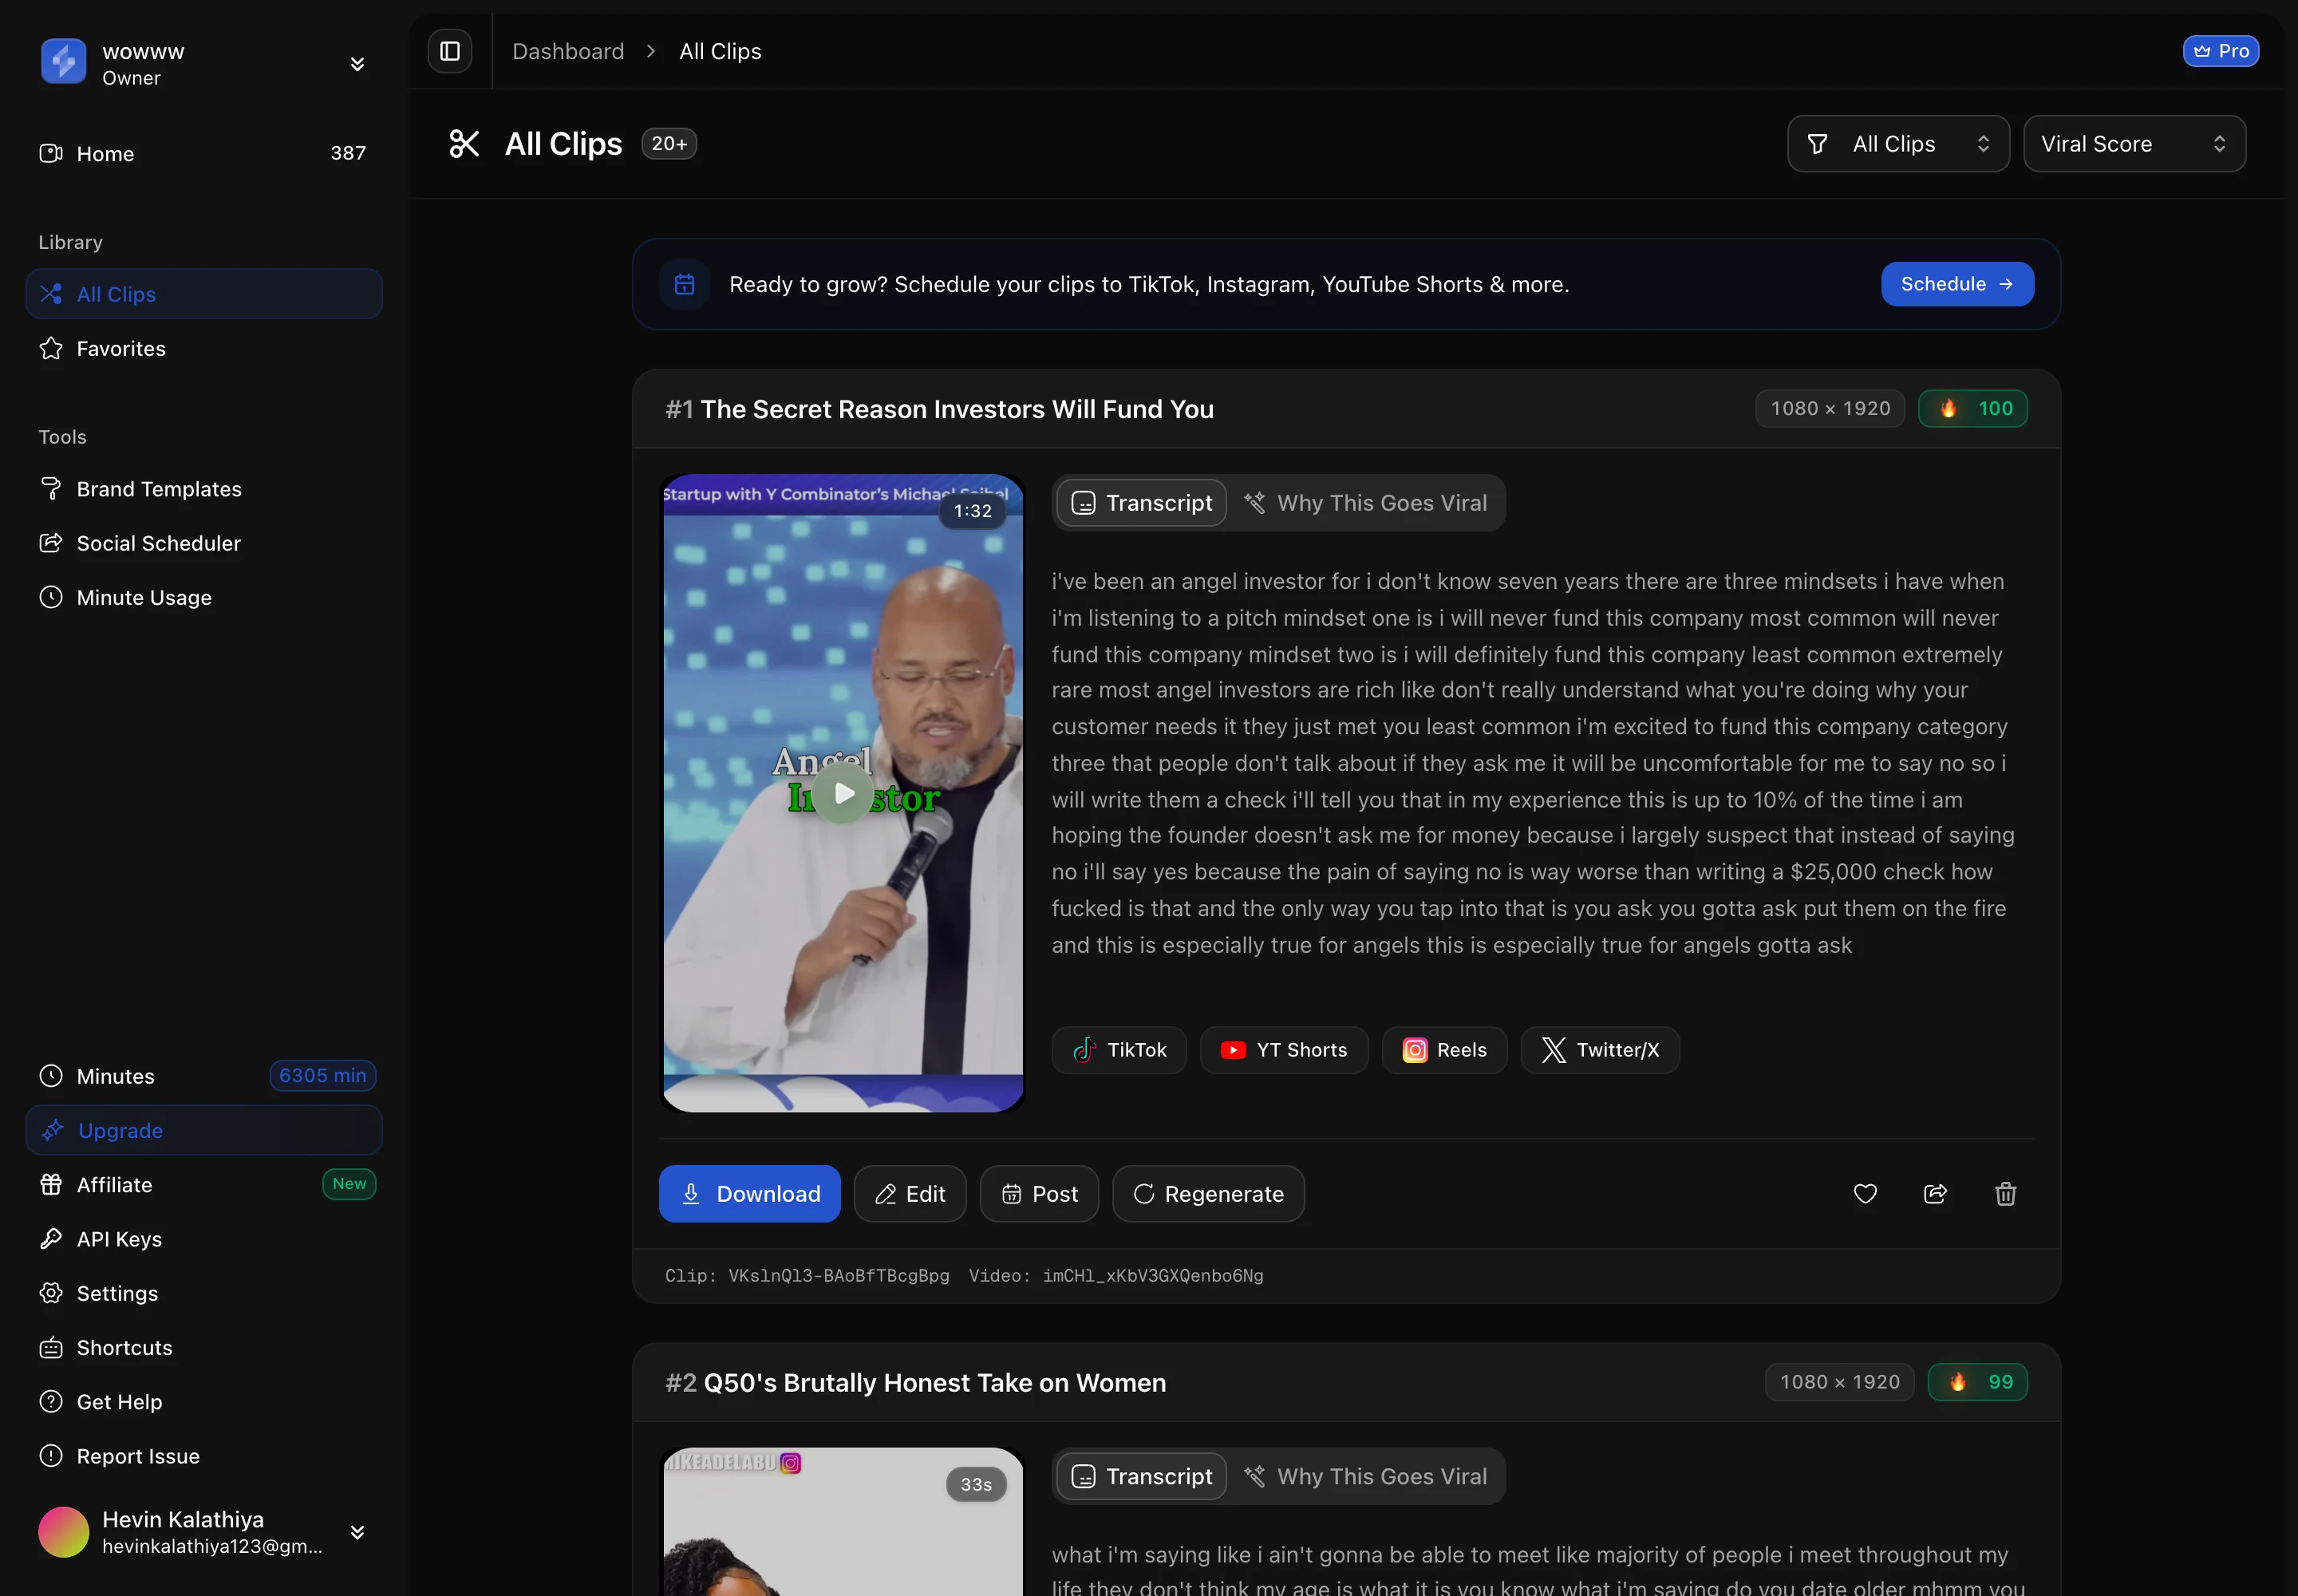
Does ScaleReach’s virality score work any differently?
Not fundamentally, and I would rather say so than pretend otherwise. Since I can read our own schema instead of our marketing, here is what is actually stored with each ScaleReach clip: a score from 0 to 100, a written viralityReason, an improvementSuggestion (a viewer-perspective edit to push a clip toward 96+, left empty once a clip already scores 96 or higher), a hooks array, an emotions array, and a list of recommended platforms. The library sorts on the score by default, the same as Opus Clip.
And our scores bunch in exactly the same way Opus Clip’s do. The honest figure, measured across 7,101 clips on 27 July 2026, is that 82% scored 80 or above. A quirk that makes the point sharper: our scale is meant to top out at 100, yet a handful of clips have come back scoring slightly above 100, which is a bug rather than a category and a fair reminder that the number is a heuristic, not physics. We would rather publish that than round it away. For the same reason, we say on every relevant page that our score is a sort key, not a verdict. For a feature-by-feature look at how the scores differ across tools, see our AI clip maker feature comparison.
FAQ
How accurate is the Opus Clip Virality Score?
It is reliable for ranking and unproven for prediction. Higher-scored clips beat lower-scored clips on average, so the score is a legitimate way to decide what to review first. But no public calibration ties an Opus Clip score to real view counts, and the scores cluster near the top, so a high number is common and does not promise a hit. Use it to triage a batch, not to forecast how a single clip will perform.
What does the Opus Clip Virality Score measure?
Opus Clip’s help centre lists four factors: Hook (does the opening grab attention and relate to the topic), Flow (does it move logically to a satisfying conclusion), Value (does it resonate and offer something useful), and Trend (is it aligned with current interests). When you use the ClipAnything model it also checks the clip against your prompt. The exact weighting between the four is not published.
Is the Opus Clip Virality Score out of 100 or 99?
Opus Clip’s own dedicated help article says the scale runs 0 to 99. Confusingly, its developer API blog and some of its marketing pages describe a 0 to 100 scale. When a vendor’s surfaces disagree, the dedicated documentation is the one to trust, so the answer is 0 to 99. It is a small thing that shows how often these figures get copied between pages rather than read off the source.
Does a high virality score mean a clip will go viral?
No. In our own pipeline 82% of 7,101 clips scored 80 or above, so a high score is the normal case rather than a signal of a guaranteed hit. Views depend on your posting time, your audience, the platform, the thumbnail, and luck, none of which a pre-publish score can see. A high score means the clip is worth reviewing first, not that it will perform.
Why do so many clips get high virality scores?
Because the models are tuned to talking-head and podcast content, and a well-structured spoken clip hits most of the factors the score rewards. The result is a distribution that bunches near the top. When most items clear the “high” threshold, the metric loses its ability to finely separate the best clip from the third-best, which is why it works better as a rough sort than as a precise ranking.
Should I trust the virality score for gaming or tutorials?
Be cautious. The score reads the transcript and spoken delivery, so it misses visual-only humor, silent gameplay, and the value in a screen-share demo. Opus Clip’s own developer guidance says to lower your score threshold by 10 to 15 points for non-talking-head content. For gaming and tutorials specifically, the score correlates poorly with what actually performs, so lean on your own judgement.
The bottom line
The Opus Clip Virality Score is a competent, transparent ranking tool. It shows its four components, it shows the transcript and source timestamps so you can audit any decision, and used as a sort key it floats the strongest moments to the top of a long list. That is a real service when you have thirty clips and time to watch three.
What it is not is a prediction of views. There is no published calibration, the scores bunch so tightly that the top band is crowded, and the model is close to deaf to anything that is not a person talking. Our own numbers say the same thing about our own score, which is why we treat it as triage rather than truth. Sort by it, watch the top few, read the reasoning, and then trust yourself. You know your audience; the model only knows the transcript.
Changelog
September 2026 update. First published. Opus Clip facts verified against help.opus.pro on 2026-09-26; ScaleReach score distribution from production pipeline data measured 27 July 2026.
Last reviewed: September 2026 Next planned refresh: December 2026 Update hooks: whether Opus Clip reconciles the 0-99 versus 0-100 discrepancy across its own pages; whether it ever publishes a calibration or accuracy figure; the four scoring factors and the Pro/Starter gate; whether ScaleReach changes its 0-100 scale or fixes the above-100 scoring bug.
About the author
Hevin K runs ScaleReach, an AI clip maker that assigns every clip a 0-100 virality score. Opus Clip is a competitor and there is no affiliate relationship. Every Opus Clip fact here is quoted from a page Opus Clip controls, with the page linked and the date it was read, and the ScaleReach figures come from our own database and source so you can judge the bias directly.
